Key Takeaways
- LGBTQ+ identification in 2025 was at 9%, down from 9.3% the year prior.
- This is up from 3.5% in 2012 and figures around 7% in the early 2020s.
- Young people continue to drive up the overall number, with 23% of adults under 30 saying they're LGBTQ+.
- The poll also measured variations by gender, race, political party, and location.
- Based on these numbers, there are 24 million out LGBTQ+ adults in America.
Gallup's latest LGBTQ+ identification poll, published on Monday, is continued good news for queer Americans. So let's all go brag to our friends about it!
Overall identification held steady at 9%, thanks to young people identifying as bisexual in larger numbers. Although slightly down from 2024's peak of 9.3%, identification continues its overall upward trajectory, having come in at 3.5% when Gallup first conducted this poll in 2012.
It means there are 24 million out LGBTQ+ adults living in America. (9% applied to 342 million people, approximately 78% of whom are adults).
Here are some important callouts to know.
Overall identification continues to rise
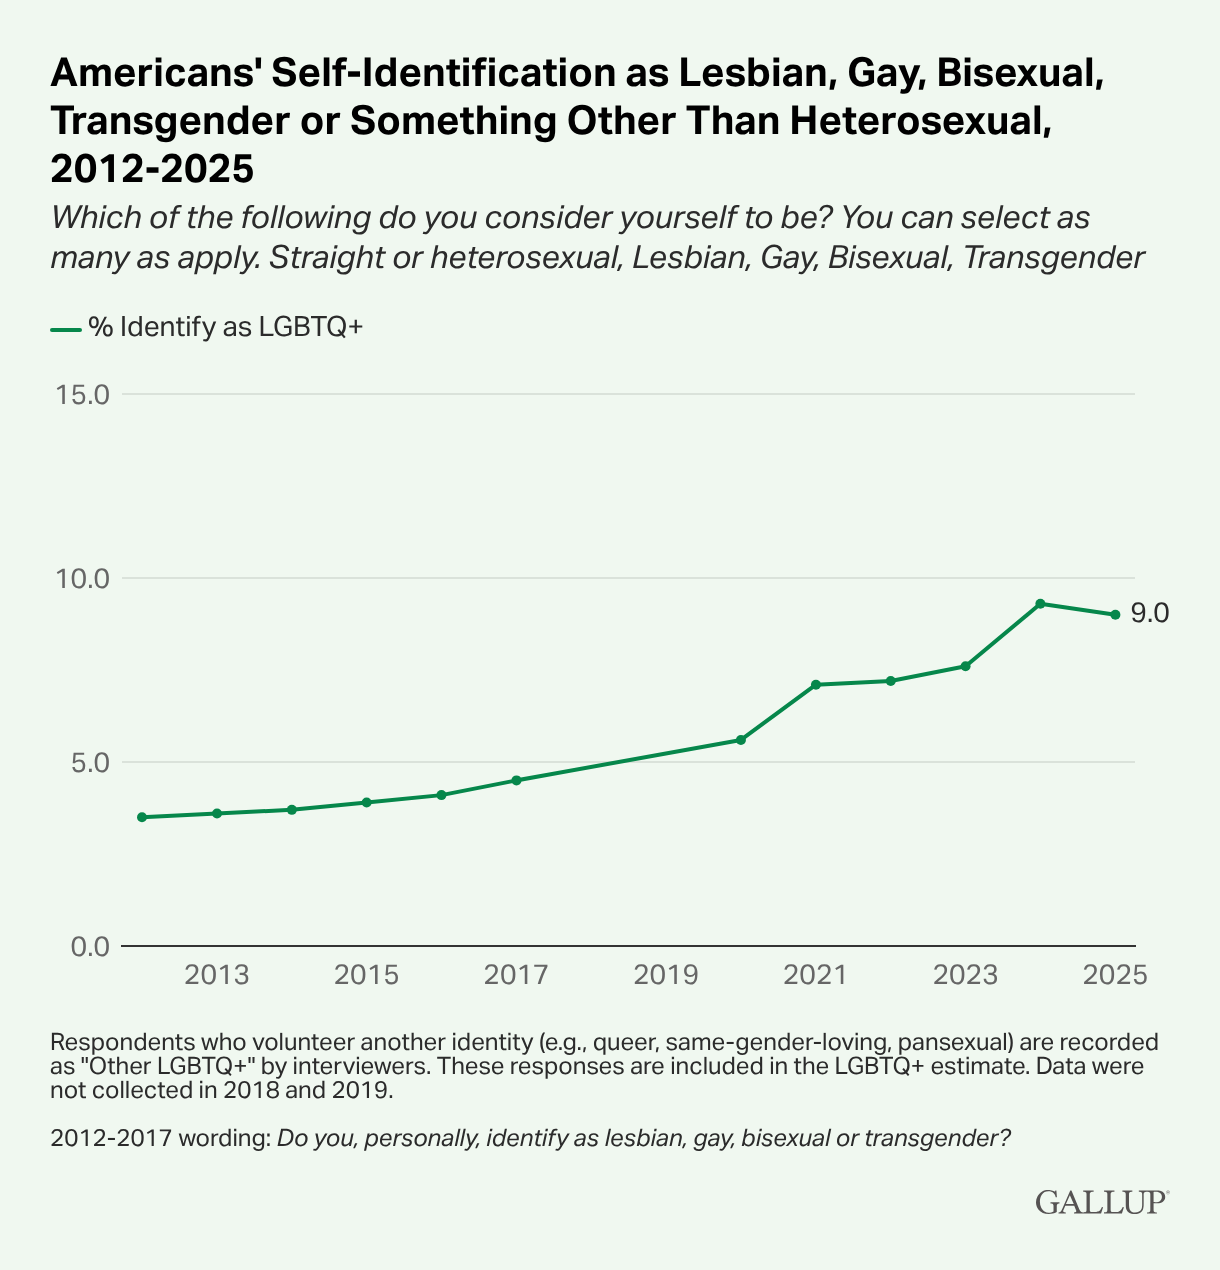
Overall identification held steady at 9%, based on 13,000 phone surveys conducted in 2025. This is the twelfth year Gallup has conducted the LGBTQ+ identification poll.
Since queer people are often not measured in federal data sets like the Census' American Community Survey, the year-over-year data produced by organizations like Gallup is some of the most valuable information we have to determine LGBTQ+ socioeconomic status and wellness.
Gallup LGBTQ+ identification by year
Poll year | Percentage |
2012 | 3.5% |
2013 | 3.6% |
2014 | 3.7% |
2015 | 3.9% |
2016 | 4.1% |
2017 | 4.5% |
2018 | Not measured |
2019 | Not measured |
2020 | 5.6% |
2021 | 7.1% |
2022 | 7.2% |
2023 | 7.6% |
2024 | 9.3% |
2025 | 9.0% |
A majority of queer people say their sexual orientation is bisexual
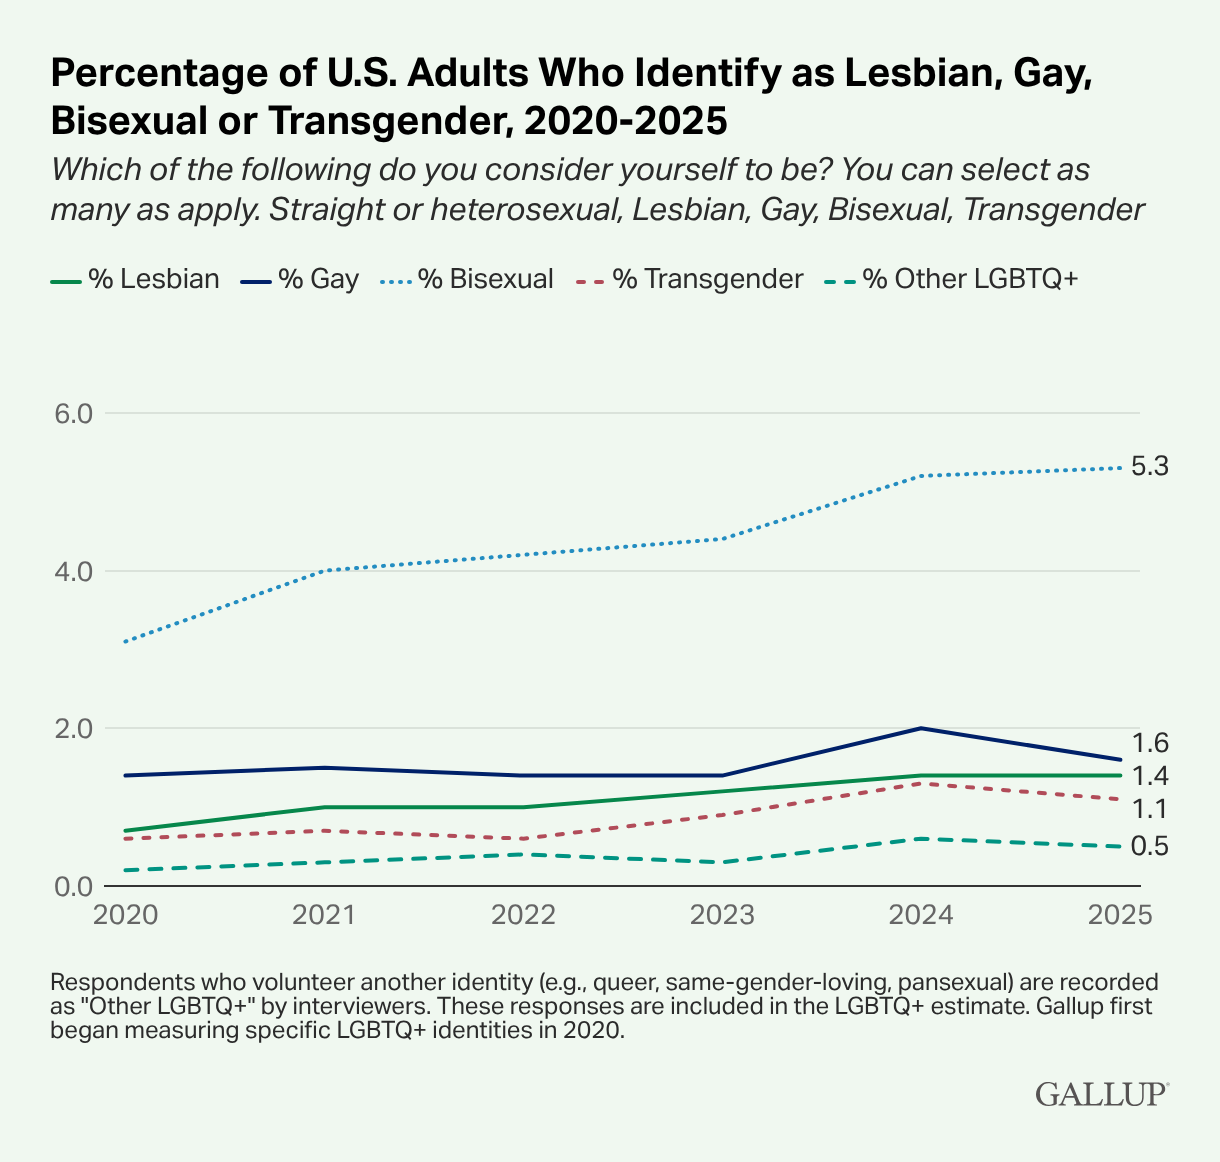
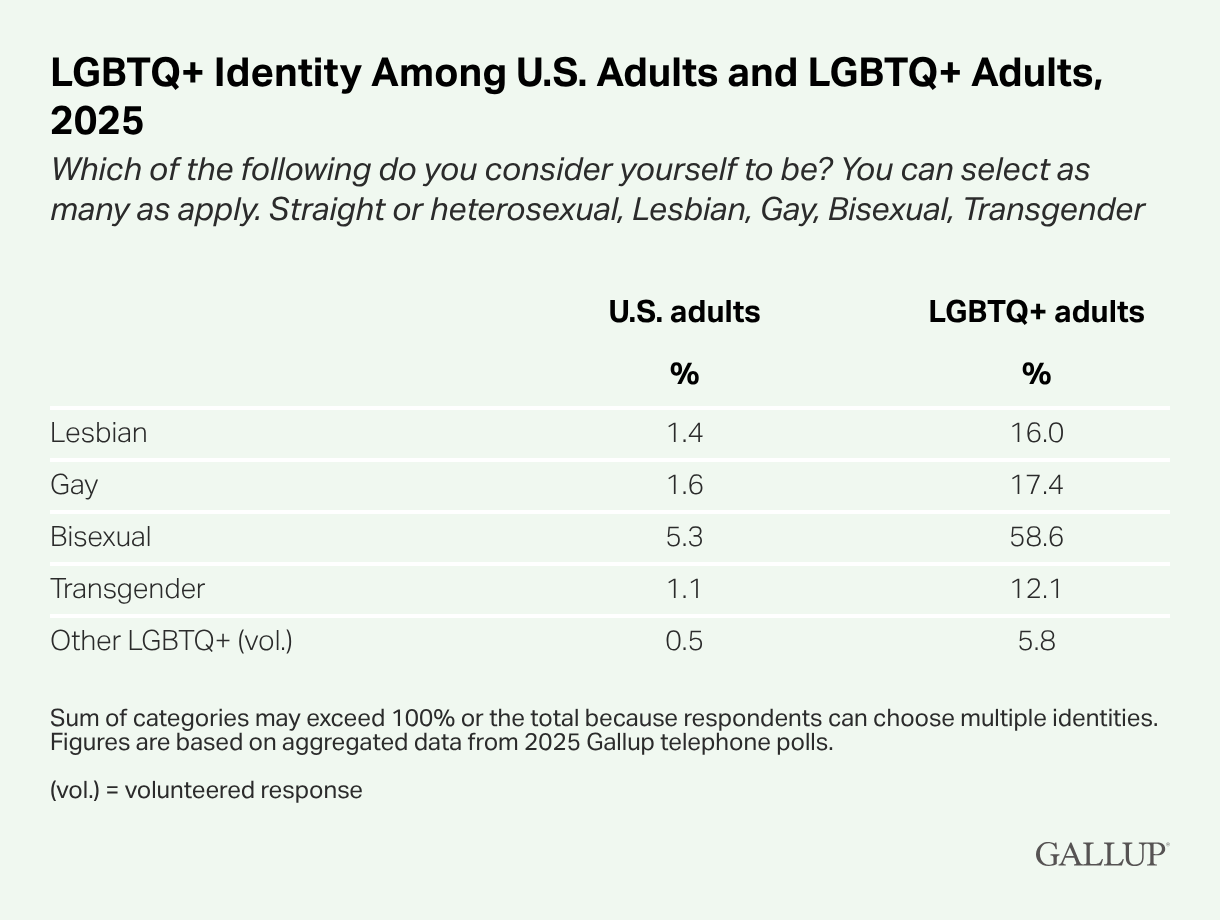
Keeping in line with past years, a majority of queer people say they're bisexual. the bisexual experience is the queer experience. But other surveys have found that bisexual people are less likely to be out to friends and family than homosexual people.
LGBTQ+ identity among U.S. adults
Identity | Share of U.S. adults | Share of LGBTQ+ adults |
Lesbian | 1.4% | 16.0% |
Gay | 1.6% | 17.4% |
Bisexual | 5.3% | 58.6% |
Transgender | 1.1% | 12.1% |
Other LGBTQ+ | 0.5% | 5.8% |
*"Other LGBTQ+" refers to volunteered responses, and included terms like pansexual, asexual, and genderqueer.
LGBTQ+ identification by age, gender, race, party identification, place of residence
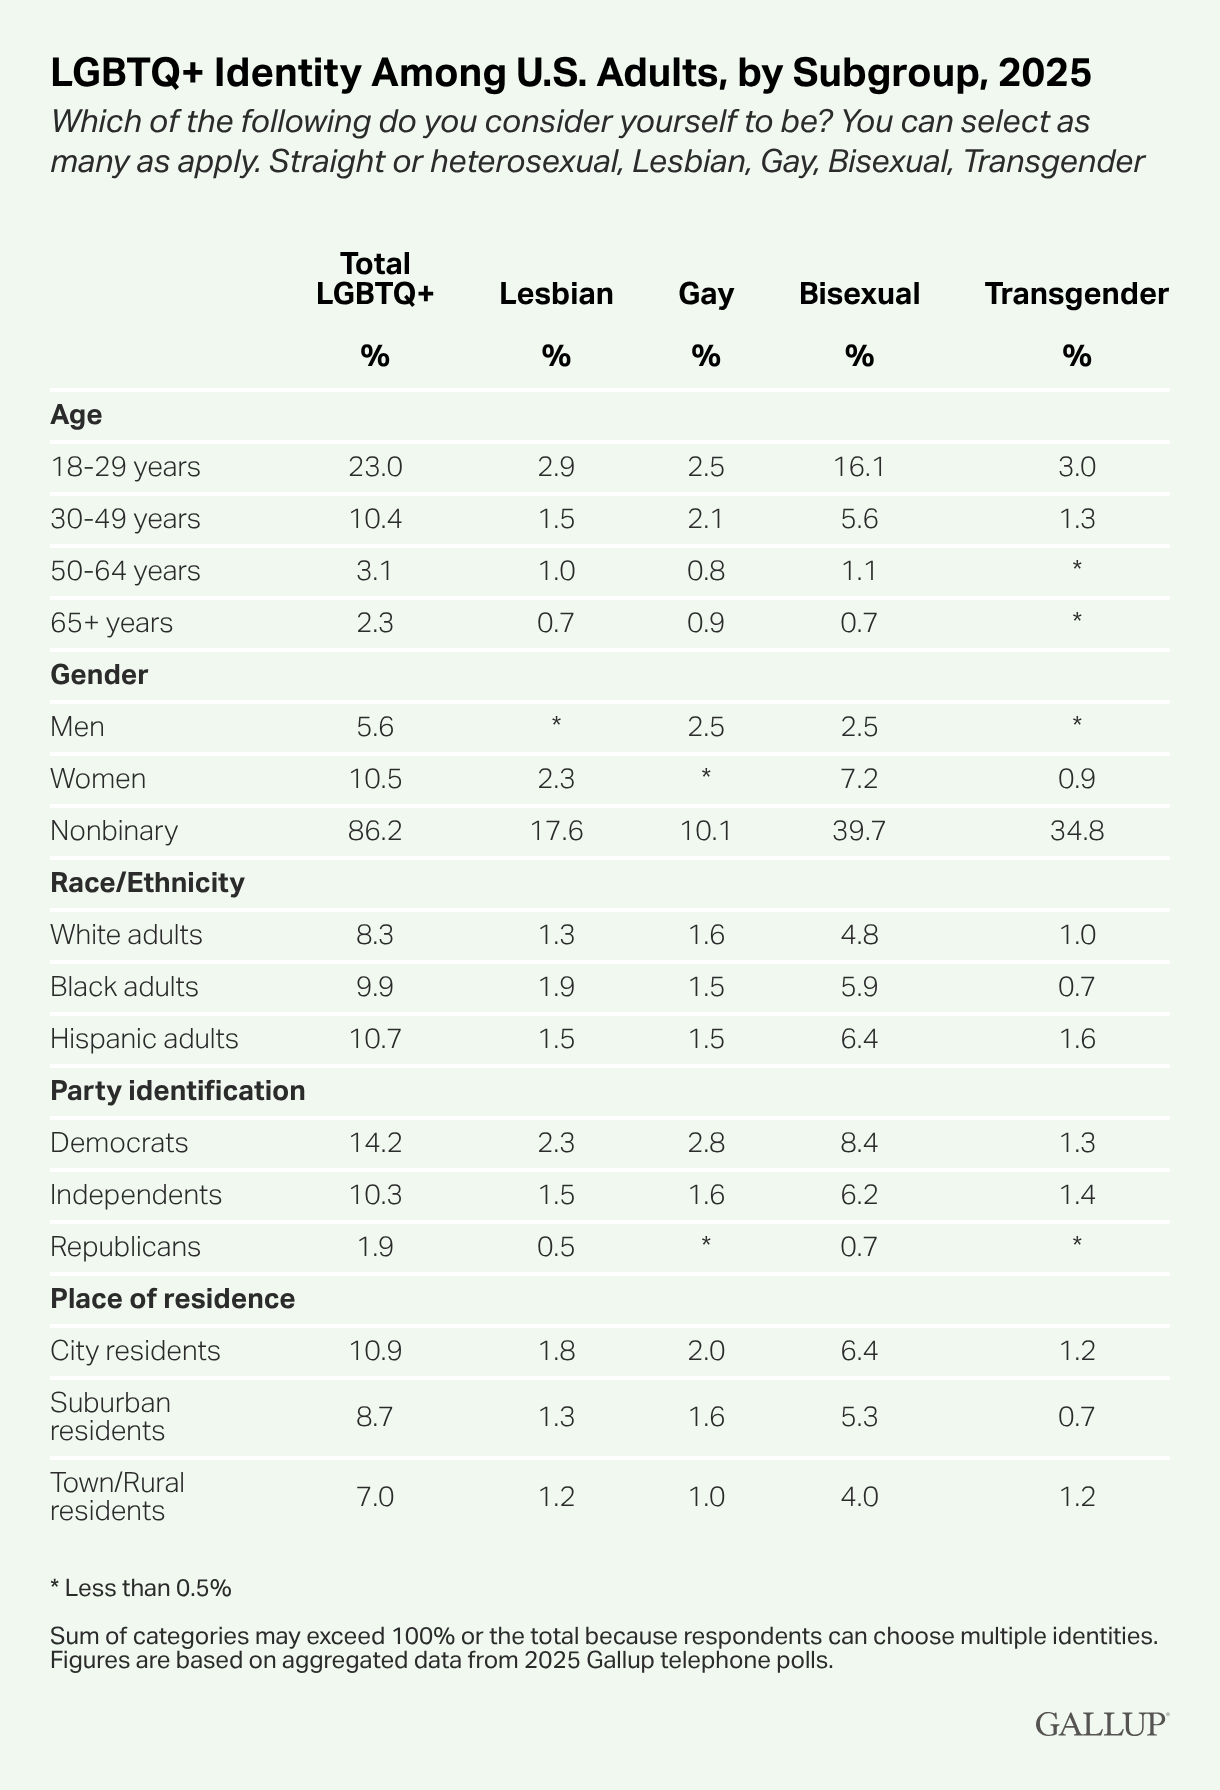
The poll also gives us insight into LGBTQ+ identification based on race, gender, political affiliation, and place of residence. (Sadly, however, nothing on whether the respondent is Team Shane or Team Ilya. #heatedrivalry)
Here are a whole bunch of charts, mostly because the column chart builder on my website only allows for a maximum of four columns in a chart. BLOOP!
LGBTQ+ identity overall by age (as % of total population)
Age Range | Total LGBTQ+ |
18-29 | 23.0% |
30-49 | 10.4% |
50-64 | 3.1% |
65+ | 2.3% |
LGBTQ+ sexuality by age (as % of total population)
Age Range | Lesbian | Bisexual | Bisexual |
18-29 | 2.9% | 2.5% | 16.1% |
30-49 | 1.5% | 2.1% | 5.6% |
50-64 | 1.0 | 0.8 | 1.1% |
65+ | 0.7% | 0.9% | 0.7% |
Transgender identity by age (as % of total population)
Age Range | Transgender |
18-29 | 3.0% |
30-49 | 1.3% |
50-64 | < 0.5% |
65+ | < 0.5% |
LGBTQ+ identity overall by race/ethnicity (as % of total population)
Ethnicity | LGBTQ+ |
White | 8.3 |
Black | 9.9 |
Hispanic | 10.7% |
LGBTQ+ sexuality by race/ethnicity (as % of total population)
Race/Ethnicity | Lesbian | Gay | Bisexual |
White | 1.3% | 1.6% | 4.8% |
Black | 1.9% | 1.5% | 5.9% |
Hispanic | 1.5% | 1.5% | 6.4% |
Transgender identity by race (as % of total population)
Race/Ethnicity | Transgender |
White | 1.0% |
Black | 0.7% |
Hispanic | 1.6% |
LGBTQ+ identity overall by political party (as % of total population)
Party | LGBTQ+ |
Democrats | 14.2% |
Independen | 10.3% |
Republicans | 1.9% |
LGBTQ+ sexuality by political party (as % of total population)
Party | Lesbian | Gay | Bisexual |
Democrats | 2.3% | 2.8% | 8.4% |
Independents | 1.5% | 1.6% | 6.2% |
Republicans | 0.5% | < 0.5% | 0.7% |
Transgender identity by political party (as % of total population)
Party | Transgend |
Democrat | 1.3% |
Independen | 1.4% |
Republicans | < 0.5% |
LGBTQ+ identity overall by place of residence (as % of total population)
Place of residence | Total LGBTQ+ |
City residents | 10.9% |
Suburban residents | 8.7% |
Town/Rural residents | 7.0% |
LGBTQ+ sexuality by place of residence (as % of total population)
Place of residence | Lesbian | Gay | Bisexual |
City residents | 1.8 | 2.0% | 6.4% |
Suburban residents | 1.3% | 1.6% | 5.3% |
Town/Rural residents | 1.2% | 1.0% | 4.0% |
Transgender identity by place of residence (as % of total population)
Place of residence | Transgender |
City residents | 1.2% |
Suburban residents | 0.7% |
Town/Rural residents | 1.2% |
A helpful analogy: Lefthandedness
So what's with all these young people being so queer?
It all goes back to destigmatization. Decades of effort and policy reform to destigmatize sexual orientation and gender identity have led people to share their true selves more openly.
The Gallup poll matters because it is revealing an important moment in queer history, one in which we collectively realize we're a much larger community than previously thought. 👋🏼
The analogy I often utilize in this moment is the analogy of left-handedness. Left-handedness was once associated with witchcraft — we were burned at the stake for it! — and implied that something was off.
In the early 20th century, scientists realized left-handedness was a normal occurrence. Subsequently, in the decades after their findings, people saying they were left handed picked up, from 1% to 10%, where it hovers today.
I believe we are in a similar moment with LGBTQ+ rights. The progress made in the last 40 years has had a clear generational effect—one that will cement our proof of existence and demand for decades to come.
Final thoughts
LGBTQ+ identification continues to go up, thanks to young people living out and proud. At about 24 million adults in the U.S. alone, queer people are a social and economic force that cannot be ignored. ◆